

'%3E%3Cpath%20d='M12.077%2031.202C26.568%2031.202%2034.493%2019.197%2034.493%208.78599C34.493%208.44499%2034.493%208.10599%2034.47%207.76799C36.012%206.65299%2037.343%205.27199%2038.401%203.68999C36.963%204.32699%2035.438%204.74499%2033.876%204.92999C35.521%203.94499%2036.752%202.39699%2037.34%200.571986C35.793%201.48999%2034.102%202.13599%2032.337%202.48399C29.895%20-0.113014%2026.014%20-0.748014%2022.871%200.933986C19.728%202.61599%2018.104%206.19699%2018.91%209.66999C12.575%209.35199%206.67295%206.35999%202.67295%201.43899C0.581953%205.03899%201.64995%209.64399%205.11195%2011.956C3.85795%2011.919%202.63195%2011.581%201.53595%2010.97C1.53595%2011.002%201.53595%2011.036%201.53595%2011.07C1.53695%2014.82%204.18095%2018.05%207.85695%2018.793C6.69695%2019.109%205.47995%2019.156%204.29995%2018.928C5.33195%2022.137%208.28995%2024.336%2011.661%2024.399C8.87095%2026.592%205.42495%2027.782%201.87695%2027.778C1.24995%2027.777%200.623953%2027.739%200.00195312%2027.664C3.60495%2029.976%207.79695%2031.202%2012.078%2031.197L12.077%2031.202Z'%20fill='%231da1f2'/%3E%3C/g%3E%3Cdefs%3E%3CclipPath%20id='clip0'%3E%3Crect%20width='38'%20height='32'%20fill='white'/%3E%3C/clipPath%3E%3C/defs%3E%3C/svg%3E%0A)
'%3E%3Cpath%20d='M-0.000953125%2011.479C-0.000953125%2010.094%200.243047%208.788%200.729047%207.567C1.21405%206.342%201.88405%205.275%202.74305%204.363C3.59805%203.452%204.58505%202.665%205.69705%201.999C6.81305%201.333%208.01105%200.833%209.29505%200.5C10.579%200.167%2011.886%200%2013.223%200C15.27%200%2017.178%200.428%2018.937%201.28C20.7%202.132%2022.132%203.373%2023.235%205.003C24.338%206.633%2024.889%208.471%2024.889%2010.522C24.889%2011.753%2024.767%2012.958%2024.519%2014.137C24.271%2015.316%2023.885%2016.452%2023.354%2017.54C22.823%2018.631%2022.176%2019.588%2021.41%2020.414C20.644%2021.24%2019.707%2021.9%2018.591%2022.396C17.475%2022.889%2016.251%2023.137%2014.917%2023.137C14.036%2023.137%2013.161%2022.931%2012.293%2022.523C11.425%2022.112%2010.801%2021.55%2010.428%2020.831C10.299%2021.331%2010.118%2022.052%209.88305%2022.996C9.64805%2023.94%209.49705%2024.547%209.42705%2024.822C9.35405%2025.096%209.22205%2025.554%209.02805%2026.187C8.83405%2026.82%208.66505%2027.278%208.52305%2027.552C8.38105%2027.826%208.17305%2028.228%207.90205%2028.754C7.63105%2029.28%207.33105%2029.776%207.00705%2030.243C6.68305%2030.71%206.28105%2031.265%205.80205%2031.905L5.53105%2032L5.35605%2031.807C5.16105%2029.795%205.06605%2028.59%205.06605%2028.192C5.06605%2027.013%205.20505%2025.687%205.48505%2024.221C5.76205%2022.751%206.19505%2020.91%206.77905%2018.692C7.36305%2016.474%207.70005%2015.172%207.78905%2014.786C7.37305%2013.953%207.16805%2012.869%207.16805%2011.537C7.16805%2010.472%207.50505%209.473%208.17805%208.536C8.85105%207.599%209.70605%207.132%2010.743%207.132C11.535%207.132%2012.149%207.393%2012.591%207.912C13.03%208.431%2013.251%209.088%2013.251%209.884C13.251%2010.73%2012.967%2011.954%2012.396%2013.558C11.825%2015.162%2011.541%2016.36%2011.541%2017.153C11.541%2017.96%2011.831%2018.632%2012.416%2019.161C13%2019.693%2013.707%2019.958%2014.535%2019.958C15.248%2019.958%2015.908%2019.798%2016.519%2019.478C17.13%2019.158%2017.638%2018.72%2018.044%2018.172C18.453%2017.62%2018.816%2017.013%2019.133%2016.343C19.45%2015.677%2019.697%2014.968%2019.872%2014.217C20.047%2013.466%2020.176%2012.754%2020.262%2012.081C20.348%2011.408%2020.387%2010.771%2020.387%2010.167C20.387%207.95%2019.677%206.222%2018.258%204.984C16.839%203.746%2014.99%203.129%2012.709%203.129C10.118%203.129%207.95205%203.958%206.21605%205.621C4.46005%207.28%203.59205%209.386%203.59205%2011.937C3.59205%2012.502%203.67505%2013.047%203.83605%2013.573C3.99705%2014.099%204.17305%2014.517%204.36105%2014.824C4.54905%2015.131%204.72405%2015.425%204.88605%2015.699C5.04805%2015.973%205.13005%2016.169%205.13005%2016.287C5.13005%2016.646%205.03405%2017.113%204.84005%2017.691C4.64605%2018.269%204.40405%2018.556%204.12005%2018.556C4.09405%2018.556%203.98505%2018.536%203.79005%2018.497C3.13005%2018.304%202.54205%2017.945%202.03105%2017.419C1.52005%2016.893%201.12305%2016.289%200.846047%2015.6C0.569047%2014.914%200.357047%2014.222%200.216047%2013.523C0.0670469%2012.824%20-0.00195312%2012.142%20-0.00195312%2011.475L-0.000953125%2011.479Z'%20fill='%23c92228'/%3E%3C/g%3E%3Cdefs%3E%3CclipPath%20id='clip0'%3E%3Crect%20width='25'%20height='32'%20fill='white'/%3E%3C/clipPath%3E%3C/defs%3E%3C/svg%3E%0A)


The year 2024 was deemed by global officials to be the warmest year on record -- easily surpassing the previous benchmark set in 2023, and warning of a steady and dangerous climate trend.
But where does that data come from? And how are scientists accurately comparing current weather data to information that was recorded decades ago?
The archive of weather data in the United States is recorded by the Historical Climatology Network, a data set of temperature, precipitation and pressure records from long-standing stations around the county, managed and analyzed by the National Oceanic and Atmospheric Administration.
When digging into conspiracies claiming that the federal agency "manipulates" its historical weather data, ABC News' chief meteorologist and chief climate correspondent Ginger Zee was able to confirm that it was true -- but that the routine, public adjustments to records happen for good reason.
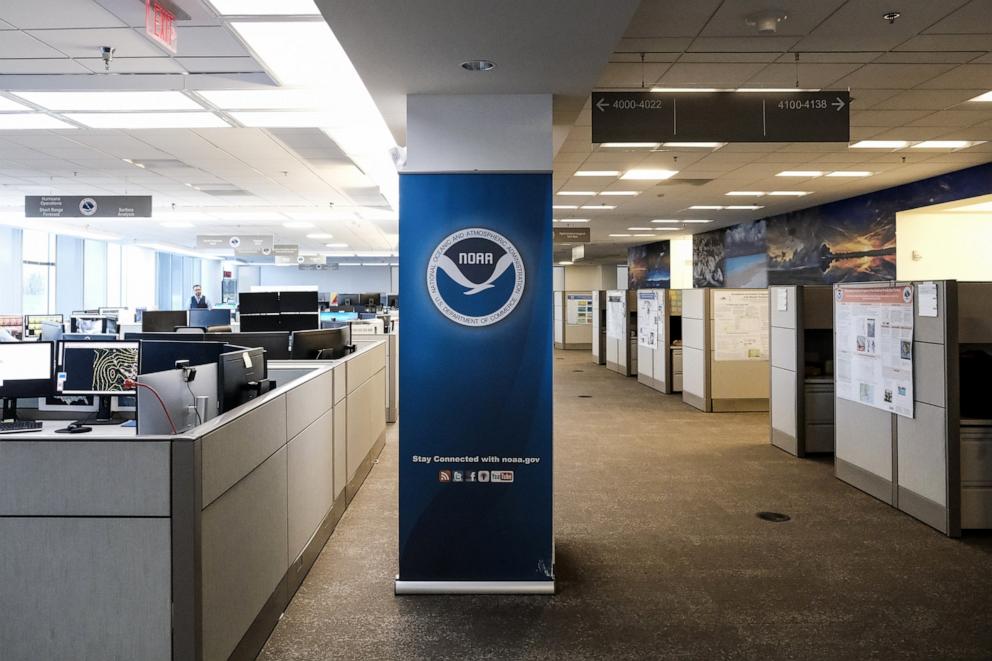
"They are in fact the world's largest provider of weather and climate data," Zee said of NOAA's National Centers for Environmental Information.
"And they constantly change things -- it's just they don't hide any of that," Zee added of the agency's public records.
Historical weather data is typically collected through a network of weather stations, satellites and other monitoring tools. However, these stations across the country and the instruments used to collect the data vary and have evolved over time, meaning that raw historical data might not always reflect accurate or consistent conditions.
Because of this, the NCEI adjusts weather data to account for factors like instrument changes, station relocation and urbanization, and it does so through peer-reviewed studies that are published publicly through its federal website.
"Just like we don't send telegrams anymore, the network of thermometers in our country has gotten way better," Zee said.
"Higher-resolution temperature data makes it more detailed, but needs to be adjusted when compared to the older stuff," she added.
For example, traditional glass thermometers have been replaced with more precise digital sensors, according to the Historical Climatology Network, warranting adjustments to accurately compare readings between the two instruments.
Similarly, sea surface temperatures used to be taken manually from a bucket off of a boat, which is not as thorough or accurate as the network of buoys and satellites that are used to gauge water temperatures today, according to Zee.
MORE: Why compostable plastic is not a silver bullet for eliminating plastic wasteUrbanization factors into weather data as well. As cities grow, they tend to heat up more than rural areas due to human activity, infrastructure and the concentration of buildings, roads and other heat-absorbing materials.
This phenomenon, known as the "urban heat island effect," can lead to higher temperatures in cities compared to surrounding areas. If weather stations are located in a dense city, these factors could distort temperature data, making the area appear hotter than they are in reality.
NOAA makes adjustments to account for the urban heat island effect to ensure the temperature records reflect true regional climate trends, not localized anomalies, according to the agency.
Additionally, instrument placement changes must be analyzed and adjusted for consistency. Weather stations are not static; they can be relocated due to construction, logistical challenges and various other reasons. But when stations move, the local microclimates may change, causing a potential shift in recorded data.
MORE: Why the sun is not solely responsible for the rapid global warming occurring right nowAdjusting historical weather data allows NOAA to account for these minor but influential climate changes, and to ensure that long-term temperature trends remain representative of the broader regional climate.
An example of this, according to Zee, was when Chicago's official weather-reading station moved from the city's downtown area, with milder lakefront temperatures, to Chicago O'Hare International Airport, much farther inland. "That's a very different temperature profile, so they adjust for that," Zee said.
While NOAA's adjustments might seem technical or obscure, they are crucial for providing a clearer, more accurate picture of climate trends. And according to the agency, the changes can mean a shift in a few tenths of a degree -- but overall, the trends remain the same.
"NOAA and climate scientists aren't manipulating data to present the planet is warming," Zee said.
"There is data all over the world, at my different agencies saying the same thing: Our temps are going up. So that's what we should talk about," she added.
ABC News' Daniel Peck and Daniel Manzo contributed this report.